Introduction
Steampipe is an open-source tool that allows you to query cloud APIs, SaaS platforms, logs, and more using SQL. It maps APIs to PostgreSQL foreign tables, enabling you to use familiar SQL syntax to retrieve and analyze live data. The Steampipe Shodan plugin (turbot/shodan) allows you to connect to the Shodan API and query its data using Steampipe. This means you can use SQL to search for devices, vulnerabilities, and other information collected by Shodan. Powerpipe is a tool for creating dashboards and running benchmarks using a simple, declarative language (HCL - HashiCorp Configuration Language). It can use Steampipe as a data source, allowing you to visualize the data you query with Steampipe, including data from the Shodan plugin.
Prerequisites
- Shodan API Key: You'll need a Shodan API key. You can get one by signing up on the Shodan website. A free tier is available, but paid plans offer more credits and capabilities.
- Steampipe Installation: If you don't have Steampipe installed, you'll need to install it first.
- Powerpipe Installation: Similarly, Powerpipe needs to be installed to create dashboards.
- Basic understanding of SQL and HCL (optional but helpful).
Setting up Steampipe and the Shodan Plugin
Install Steampipe
Follow the official Steampipe installation instructions for your operating system: https://steampipe.io/downloads
For example, on macOS using Homebrew:
brew install steampipeVerify the installation:
steampipe --versionInstall the Shodan Plugin
Once Steampipe is installed, you can install the Shodan plugin:
steampipe plugin install shodanSteampipe will download and install the plugin.
Configure the Shodan Plugin (API Key)
The Shodan plugin requires your API key to authenticate requests. Steampipe manages plugin configurations in .spc files located in the ~/.steampipe/config directory.
When you install the Shodan plugin, it might create a default configuration file named shodan.spc. If not, you can create it.
Navigate to your Steampipe configuration directory:
Terminal window cd ~/.steampipe/configCreate or edit the
shodan.spcfile:Terminal window connection "shodan" {plugin = "shodan"# Your Shodan API key# You can also set this via the SHODAN_API_KEY environment variableapi_key = "YOUR_SHODAN_API_KEY"}Replace
YOUR_SHODAN_API_KEYwith your actual Shodan API key.
Querying Shodan with Steampipe
With the plugin installed and configured, you can now query Shodan using Steampipe's SQL interface.
Start the Steampipe query console:
steampipe queryAvailable Tables
The Shodan plugin provides several tables that map to different Shodan API endpoints. You can inspect the available tables and their schemas:
-- List Shodan plugin tables.inspect shodan
-- Show columns for the shodan_host table.inspect shodan_host
Refer to the official Steampipe Shodan plugin documentation on the Steampipe Hub for a complete list of tables and their schemas.
Common tables include:
shodan_host: Information about a specific IP address, including open ports, services, vulnerabilities, and more.shodan_search: Perform a Shodan search query.shodan_dns_domain: Get all the subdomains and other DNS entries for the given domain.shodan_dns_resolve: Look up the IP address for the given hostname(s).
Example Queries
Here are some examples of SQL queries you can run against Shodan data:
1. Get information about a specific IP address:
SELECT * FROM shodan_host WHERE ip = '8.8.8.8';Result:
+---------+---------+----------------+------------+---------------------------+------------+--------+----------+------+--------+| ip | asn | hostnames | isp | last_update | org | os | ports | tags | vulns |+---------+---------+----------------+------------+---------------------------+------------+--------+----------+------+--------+| 8.8.8.8 | AS15169 | ["dns.google"] | Google LLC | 2025-05-13T18:08:15-07:00 | Google LLC | <null> | [443,53] | [] | <null> |+---------+---------+----------------+------------+---------------------------+------------+--------+----------+------+--------+2. Find open ports and services for an IP using shodan_host_service:
SELECT ip, port, transport, product, version, domains, vulns, timestampFROM shodan_host_serviceWHERE ip = '1.1.1.1';Result:
+---------+-------+-----------+------------+---------+-------------+--------+---------------------------+| ip | port | transport | product | version | domains | vulns | timestamp |+---------+-------+-----------+------------+---------+-------------+--------+---------------------------+| 1.1.1.1 | 53 | tcp | | | ["one.one"] | <null> | 2025-05-13T06:51:29-07:00 || 1.1.1.1 | 443 | tcp | CloudFlare | | ["one.one"] | <null> | 2025-05-13T18:03:49-07:00 || 1.1.1.1 | 161 | udp | | | ["one.one"] | <null> | 2025-05-12T21:42:47-07:00 || 1.1.1.1 | 8,080 | tcp | CloudFlare | | ["one.one"] | <null> | 2025-05-13T17:39:55-07:00 || 1.1.1.1 | 2,086 | tcp | | | ["one.one"] | <null> | 2025-05-13T16:12:46-07:00 || 1.1.1.1 | 53 | udp | | | ["one.one"] | <null> | 2025-05-13T18:08:24-07:00 || 1.1.1.1 | 80 | tcp | CloudFlare | | ["one.one"] | <null> | 2025-05-13T17:54:15-07:00 || 1.1.1.1 | 8,880 | tcp | CloudFlare | | ["one.one"] | <null> | 2025-05-13T16:42:47-07:00 || 1.1.1.1 | 2,087 | tcp | | | ["one.one"] | <null> | 2025-05-13T09:58:06-07:00 || 1.1.1.1 | 2,052 | tcp | | | ["one.one"] | <null> | 2025-04-17T00:47:28-07:00 || 1.1.1.1 | 2,083 | tcp | | | ["one.one"] | <null> | 2025-05-13T15:48:41-07:00 || 1.1.1.1 | 2,082 | tcp | | | ["one.one"] | <null> | 2025-05-13T14:07:16-07:00 || 1.1.1.1 | 8,443 | tcp | | | ["one.one"] | <null> | 2025-05-13T12:45:00-07:00 |+---------+-------+-----------+------------+---------+-------------+--------+---------------------------+3. Search for devices with a specific term (e.g., "apache"):
SELECT ip, port, org, banners -- This 'data' column can be complex JSON, inspect its structureFROM shodan_searchWHERE query = 'apache country:"US"'; -- Example Shodan search queryResult:
+-----------------+-------+--------------------------------------------+----------------------------------------------------------->| ip | port | org | banners >+-----------------+-------+--------------------------------------------+----------------------------------------------------------->| 162.215.174.155 | 80 | Unified Layer | ["HTTP/1.1 200 OK\r\nDate: Thu, 08 May 2025 05:57:48 GMT\r>| 54.245.80.178 | 443 | Amazon.com, Inc. | ["HTTP/1.1 403 Forbidden\r\nDate: Tue, 15 Apr 2025 07:37:5>| 67.205.41.29 | 443 | New Dream Network, LLC | ["HTTP/1.1 200 OK\r\nDate: Tue, 13 May 2025 17:20:34 GMT\r>Exit the Steampipe query console:
.quitSetting up Powerpipe
Install Powerpipe
Follow the official Powerpipe installation instructions: https://powerpipe.io/downloads For example, on macOS using Homebrew:
brew install turbot/tap/powerpipeVerify the installation:
powerpipe --versionCreating Powerpipe Dashboards with Shodan Data
Create a Powerpipe Mod
Create a new directory for your Powerpipe mod:
mkdir ~/my-shodan-dashboardscd ~/my-shodan-dashboardsDefine a Dashboard
Dashboards in Powerpipe are defined in .pp files using HCL. Create a new file for your dashboard, for example, shodan_dashboard.pp:
// Define the variable for the target IP address at the mod levelvariable "target_ip" { type = string description = "Target IP Address for Shodan query." default = "1.1.1.1"}
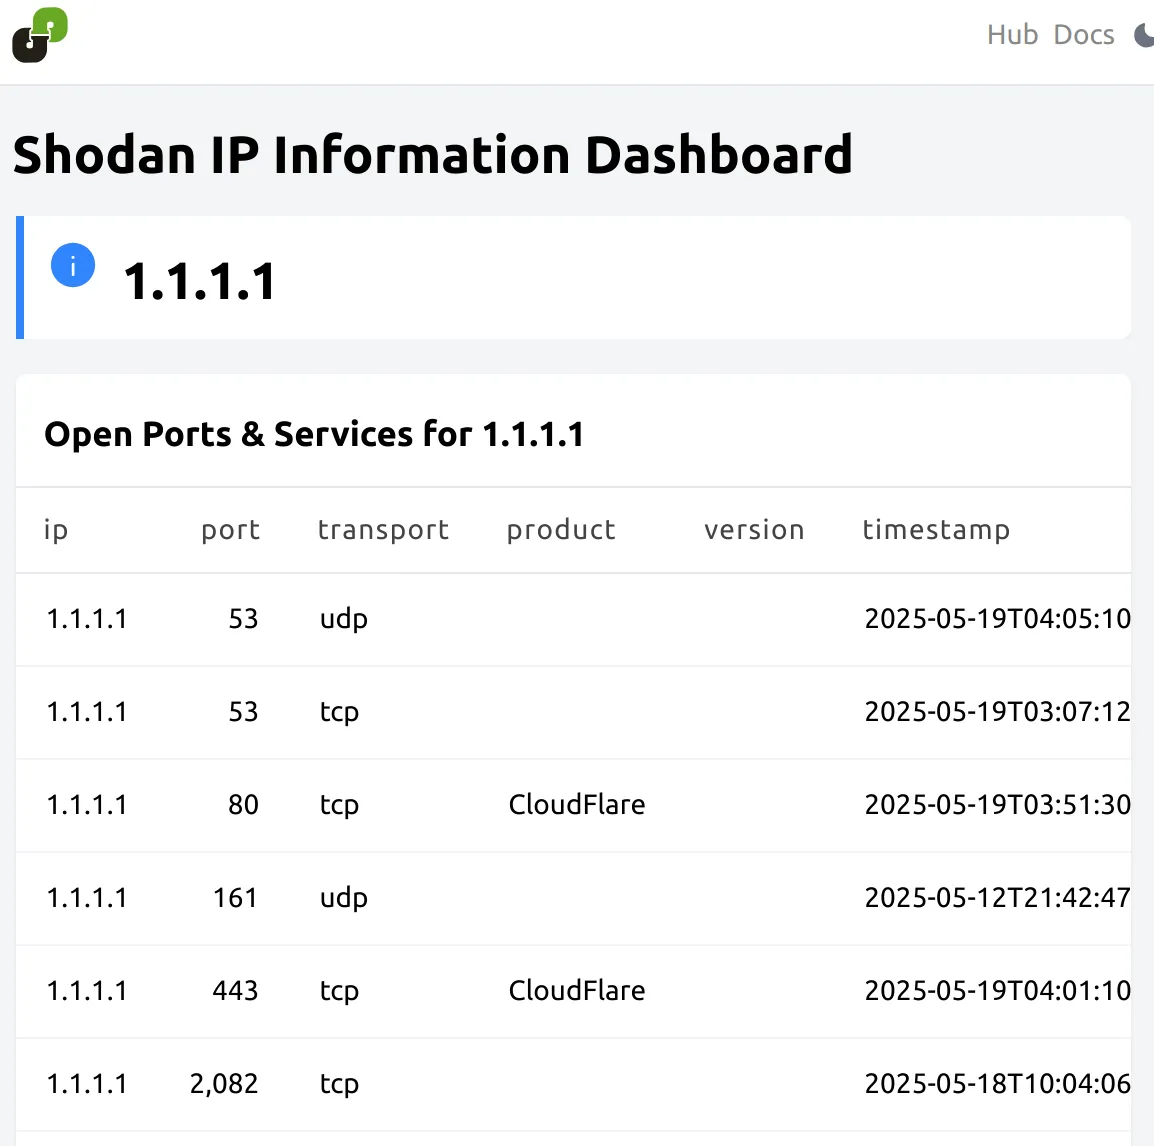
dashboard "shodan_overview" { title = "Shodan IP Information Dashboard" tags = { service = "shodan" type = "overview" }
// Container for host details container { card { value = "${var.target_ip}" args = { ip_address = var.target_ip // Use var.target_ip } type = "info" width = 6 }
// Table to display open ports and services table { title = "Open Ports & Services for ${var.target_ip}" // Use var.target_ip query = query.shodan_host_services_list args = { ip_address = var.target_ip // Use var.target_ip } width = 6
} }}
query "shodan_host_services_list" { sql = <<-EOQ SELECT ip, port, transport, product, version, timestamp FROM shodan.shodan_host_service WHERE ip = $1 ORDER BY port; EOQ param "ip_address" { default = "1.1.1.1" }}Running the Powerpipe Dashboard
Ensure Steampipe Service is Running:
Terminal window steampipe service startCheck its status:
Terminal window steampipe service statusStart the Powerpipe Server:
Navigate to your mod directory (
~/my-shodan-dashboards) and run:Terminal window powerpipe serverView the Dashboard:
Open your web browser and go to
http://localhost:9033.